


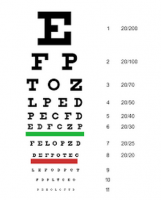
A Snellen chart is an eye chart that can be used to measure visual acuity. Snellen charts are named after the Dutch ophthalmologist Herman Snellen who developed the chart in 1862.Many vision scientists and clinicians now use an improved chart known as the LogMAR chart.
Dr. Herman Snellen did for the field of vision testing is comparable to what the first automobile engineers did to revolutionize the car industry. These pioneers saw a need for change and additional resources at a time when people were yearning for better quality and higher standards of living in their day-to-day experiences.
The Snellen eye chart got its start in 1862 during the Second Industrial Revolution, nearly 150 years ago. At that time, ophthalmology was at the brink of a period that would later be called “The Golden Age of Ophthalmology”, during which ophthalmology would become the first organ-based specialty. Dr. Snellen, a Dutch ophthalmologist, developed the Snellen chart to measure a person’s visual performance against an objectively defined and repeatable reference standard. At this point, there were only reading tests that relied on whatever fonts were available at the local print shop, but no objective standards.
To provide a standard, Dr. Snellen designed stylized letters on a 5x5 grid, which he called “optotypes.” He defined the reference standard (known today as “20/20”) as the ability to recognize one of his optotypes when it subtends an angle of 5 minutes of arc. He described this as a size that can be “easily recognized by normal observers.”
The original Snellen chart had a rectangular shape with seven rows of letters printed progressively smaller as you move down the chart. Many variations of the Snellen chart exist today. Their commonalities include the rectangular shape, which dictates that varying numbers of optotypes occur on each line as the space allows. Different charts may have a different number of lines and may vary in the size progression.


")


